The Beauty of the Blockchain


The meteoric rise in the value of bitcoins has put a spotlight on the blockchain, which is the primary public, digital ledger for bitcoin transactions. A blockchain allows digital transactions to be transparent and distributed, but not copied. It is thought to be the brainchild of an anonymous person or group operating under the pseudonym Satoshi Nakamoto.

The bitcoin network has attracted attention from almost all industries and experts due to its variable market value. These captains of industry and the experts are trying to figure out how this technology can be adapted to and integrated with their work. The dictionary definition of blockchain is, “A digital ledger in which transactions made in bitcoin or another cryptocurrency are recorded chronologically and publicly.” This definition is derived from the most popular implementation of blockchain technology — the bitcoin. But blockchain is actually not bitcoin. Let’s have a look at blockchain technology, in general.

Distributed ledger technology (DLT)

Distributed ledger technology includes blockchain technologies and smart contracts. While DLT existed prior to bitcoin or blockchain, it marks the convergence of a host of technologies, including the time-stamping of transactions, peer-to-peer (P2P) networks, cryptography, shared computational power, as well as a new consensus algorithm. In short, distributed ledger technology is generally made up of three basic components:

  • A data model that captures the current state of the ledger.
  • A language of transactions that changes the ledger state.
  • A protocol used to build consensus among participants around which transactions will be accepted by the ledger and in what order.

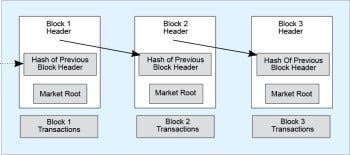
Figure 1: Structure of a block in the chain

What is blockchain technology?

Blockchain is a specific form or sub-set of distributed ledger technologies, which constructs a chronological chain of blocks; hence the name ‘blockchain’. A block refers to a set of transactions that is bundled together and added to the chain at the same time. A blockchain is a peer-to-peer distributed ledger, forged by consensus, combined with a system for smart contracts and other assistive technologies. Together, these can be used to build a new generation of transactional applications that establish trust, accountability and transparency at their core, while streamlining business processes and legal constraints. The blockchain then tracks various assets, the transactions are grouped into blocks, and there can be any number of transactions per block. A block commonly consists of the following four pieces of metadata:

  • The reference to the previous block
  • The proof of work, also known as a nonce
  • The time-stamp
  • The Merkle tree root for the transactions included in this block

Is a blockchain similar to a database?

Blockchain technology is different from databases in some key aspects. In a relational database, data can be easily modified or deleted. Typically, there are database administrators who may make changes to any part of the data or its structure and even to relational databases. A blockchain, however, is a write-only data structure, where new entries get appended onto the end of the ledger. There are no administrator permissions within a blockchain that allow the editing or deleting of data. Also, the relational databases were originally designed for centralised applications, where a single entity controls the data. In contrast, blockchains were specifically designed for decentralised applications.

Types of blockchains

A blockchain can be both permissionless (e.g., bitcoin and Ethereum) or permissioned, like the different Hyperledger blockchain frameworks. The choice between permissionless and permissioned blockchains is driven by the particular use case.

A permissionless blockchain is also known as a public blockchain, because anyone can join the network. A permissioned blockchain, or private blockchain, requires pre-verification of the participants within the network, who are usually known to each other.

Characteristics of blockchains

Here is a list of some of the well-known properties

of blockchains.

The immutability of the data which sits on the blockchain is perhaps the most powerful and convincing reason to deploy blockchain-based solutions for a variety of socio-economic processes that are currently recorded on centralised servers. This ‘unchanging over time’ feature makes the blockchain useful for accounting and financial transactions, in identity management and in asset ownership, management and transfer, just to name a few examples. Once a transaction is written onto the blockchain, no one can change it or, at least, it would be extremely difficult to do so.

Transparency of data is embedded within the network as a whole. The blockchain network exists in a state of consensus, one that automatically checks in with itself. Due to the structure of a block, the data in a blockchain cannot be corrupted; hence altering any unit of information in it is almost impossible. Though, in theory, this can be done by using a huge amount of computing power to override the entire network, this is not possible practically.

By design, the blockchain is a decentralised technology. Anything that happens on it is a function of the network, as a whole. A global network of computers uses blockchain technology to jointly manage the database that records transactions. The consensus mechanism discussed next ensures the correctness of data stored on the blockchain.

By storing data across its network, the blockchain eliminates the risks that come with data being held centrally, and the network lacks centralised points of vulnerability that are prone to being exploited. The blockchain ensures all participants in the network use encryption technologies for the security of the data. Primarily, it uses PKI (public key infrastructure), and it is up to the participants to select other encryption technologies as per their preference.

What are consensus mechanisms and the types of consensus algorithms?

Consensus is an agreement among the network peers; it refers to a system of ensuring that participants agree to a certain state of the system as the true state. It is a process whereby the peers synchronise the data on the blockchain. There are a number of consensus mechanisms or algorithms. One is Proof of Work. Others include Proof of Stake, Proof of Elapsed Time and Simplified Byzantine Fault Tolerance. Bitcoin and Ethereum use Proof of Work, though Ethereum is moving towards Proof of Stake.

What are smart contracts?

Back in 1996, a man named Nick Szabo coined the term ‘smart contract’. You can think of it as a computer protocol used to facilitate, verify, or enforce the negotiation of a legal contract. A smart contract is a phrase used to describe computer code. Smart contracts are simply computer programs that execute predefined actions when certain conditions within the system are met. Smart contracts provide the language of transactions that allows the ledger state to be modified. They can facilitate the exchange and transfer of anything of value (e.g., shares, money, content and property).

Open source blockchain frameworks, projects and communities

Looking at the current state of research and some of the implementations of blockchain technologies, we can certainly say that most enterprise blockchain initiatives are backed by open source projects. Here’s a list of some of the popular open source blockchain projects.

  • Hyperledger is an open source effort created to advance cross-industry blockchain technologies. Hosted by the Linux Foundation, it is a global collaboration of members from various industries and organisations.
  • Quorum is a permissioned implementation of Ethereum, which supports data privacy. Quorum achieves data privacy by allowing data visibility on a need-to-know basis, using a voting-based consensus algorithm. Interestingly, Quorum was created and open sourced by J.P. Morgan.
  • Chain Core, created by chain.com, was initially designed for financial services institutions and for things like securities, bonds and currencies.
  • Corda is a distributed ledger platform designed to record, manage and automate legal agreements between businesses. It was created by the R3 Company, which is a consortium of over a hundred global financial institutions.

Originally published at opensourceforu.com on June 2, 2018.

Building the Community Around Containerised OpenStack Deployment


Kolla provides production-ready containers and deployment tools for operating OpenStack clouds that are scalable, fast, reliable and upgradable — using community best practices.

I still remember the kind of applause I got from my colleagues when I got my first OpenStack deployment working. Most of the things then worked around DevStack, the development environment of OpenStack, and vendors were still trying to find the right mix of DevOps tools to deploy OpenStack. The evolution process involved working with tools like Chef, Puppet and Ansible, with vendors creating a deployment model around them. Then came Docker, creating a buzz with a lost Linux feature called containers. A group of community members came together to see if they could containerise the OpenStack services and deploy them. The project started with the sole mission of containerising OpenStack into microservices and providing additional tooling to simplify management.

The entry barrier for Kolla

The arrival of Kolla was not particularly welcomed by the community, which was busy with already proven technologies to automate the OpenStack deployment process. At the same time, the Kolla team had its own set of challenges to cope with. Docker was itself very new at this stage, with very limited automation frameworks to use. The project went through a set of repeated events, while rediscovering the architectural changes and tools to be used. The initial implementation focused on creating the individual Docker images for core services for Centos and Ubuntu operating system flavours and deploying them with Kubernetes, which was just picking up. The configuration management part was still a half-solved puzzle, and networking was far below the requirements of both OpenStack deployment as well as its users. The deployment part was then rewritten in docker-compose, which at that time was the most popular deployment framework for multiple containers to add one more version of project rewrites.

Deploying containerised OpenStack with Kolla and Ansible

With the time spent fiddling around with the OpenStack Docker images, the Kolla team decided to reinvent the architecture again, and look for alternatives that could help deploy the containerised services with better control. This time, the team turned towards Ansible — at that time one of the latest configuration management tools on the horizon; it was still awaiting wider community adoption, so there were few preconceived notions about containers. The Kolla team used the same container images and a few known bits of the Ansible framework to get the first successful deployment. The configuration management part was well managed with Ansible. During the process, the team made a lot of changes in the Ansible Docker module, which was then contributed back to the Ansible project.

Making baby steps towards wider community adoption

The initial deployment of Kolla with Ansible was an achievement that attracted a lot of attention towards Kolla as a deployment framework for OpenStack, resulting in a number of contributors and innovative ideas from users who did different PoCs (proofs-of-concept). The team’s diversity increased and it was accepted as a part of the Big Tent governance model of the OpenStack Foundation. The Docker images were central to the adoption of Kolla and the image creation got a major revamp. Jinja based image templates took the place of individual Docker files and a configuration based build framework to build specific images. The same framework was again extended to include changes so that vendors could create custom images with little changes. As the deployment matured, along with demand from the community, the team took steps to create reusable independent modules. The project was split into two major reusable components, the image build part and the deployment part. This gave vendors better control over the consumption of Kolla based container images in their existing frameworks — as an alternative to bare-metal/VM based deployment.

Deployment with Kubernetes

As Kubernetes matured, and in response to requirements from major vendors who wanted to use Kubernetes as their orchestration platform, Kubernetes based deployment again came into the picture for Kolla images. This development is still in its nascent stage, with the 1.0 milestone in sight with core services deployment. It is still getting rewritten with different existing Ansible automation features as well as a native Kubernetes tools like Helm.

Contributing to Kolla

The Kolla project is now one of the popular repositories in the OpenStack community with containerised images of almost all Big Tent projects. The deployment automation for most of the projects is also complete with the remaining undergoing reviews. There are three major deliverables:

  • kolla, the image build repository
  • kolla-ansible, the Ansible based deployment automation
  • kolla-kubernetes, the Kubernetes based deployment automation

The Kolla repositories are hosted under OpenStack GitHub, under the Apache 2 licence. Have a look at the project documentation, connect with the community on Freenode at #openstack-kolla channel or subscribe to the openstack-dev mailing list. The Docker images are also available on Docker Hub. You can have a look at project milestones, features and bug reports on Launchpad.


Originally published at opensourceforu.com on May 8, 2018.

Kata Containers: Secure Containers from the OpenStack Community


Kata Containers is new container technology that combines technology from Intel Clear Containers with runV from Hyper. Managed by a community, the objective of Kata is to deliver speed and security.

Ever since Linux containers were launched with Docker, containerisation has become a full-fledged domain. Containers are now used in a number of applications and, as in the case of all developing technologies, real-life challenges linked to performance and security have begun to matter with containers as well.

Intel has been working on the Clear Containers Project for some time to address security concerns within containers through Intel Virtualization Technology (Intel VT). This essentially offers the capability to launch containers as lightweight virtual machines (VMs), providing an alternative runtime, which is interoperable with popular container environments such as Kubernetes and Docker. At the same time, the Hyper community has been working on providing the alternate OCI-compliant runtime to run containers on hypervisors, with a few limitations caused by the current incompatibility between hypervisors and containers.

In recent times, it’s been noticed that single vendor open source projects and communities do not attract many contributors due to their inherent vendor-specific policies. There has always been a need for an open source community to build these projects up, along with the current set of contributors, and drive further collaborative innovation.

During the last KubeCon, OpenStack Foundation announced a new initiative aimed at unifying the speed and manageability of containers with the security advantages of virtual machines (VMs). This was called Kata Containers.

What are Kata Containers?

Kata Containers is an open source project and community, working to build a standard implementation of lightweight virtual machines (VMs) that feel and perform like containers, but provide the workload isolation and security advantages of VMs. Intel is contributing Intel Clear Containers technology and Hyper is contributing the runV technology to initiate the project. The Kata Containers community will initially merge both the technologies at their current state to provide light and fast VM based containers

An overview of the project

The Kata Containers project will initially comprise six components, including the agent, runtime, proxy, shim, kernel and packaging of QEMU 2.9.The initial set of projects is essentially based on projects from contributing projects like Clear Containers or runV. It is designed to be architecture agnostic, run on multiple hypervisors and be compatible with the OCI specifications for Docker containers and CRI-O for Kubernetes. For now, Kata will only run on chips based on the x86 architecture and will only support KVM as its hypervisor. The plan is to expand support to other architectures and hypervisors over time.

For users, Kata Containers does not yet provide an installation option directly. Users can either install Clear Containers or runV, since both projects will provide a migration path to Kata Containers at a later date.

The community

Kata Containers is hosted on GitHub under the Apache 2 licence. While it will be managed by the OpenStack Foundation, it is an independent project with its own technical governance and contributor base. The Kata Containers project is governed according to the ‘four opens’ — open source, open design, open development and open community. Technical decisions will be made by technical contributors and a representative architecture committee. The community also has a working committee to make non-technical decisions and help influence the project’s overall strategy, including marketing, communications, product management and ecosystem support.

Contributing to Kata Containers

Kata Containers is working to build a global, diverse and collaborative community. If you are interested in supporting the technology, you are welcome to participate. There is a requirement for contributors with different expertise and skills, ranging from development, operations, documentation, marketing, community organisation and product management. You can learn more about the project at katacontainers.io, or view the code repositories on GitHub to contribute to the project. You can also talk to fellow contributors on Freenode IRC: #kata-dev or Kata Containers Slack or subscribe to the kata-dev mailing list.


Originally published at opensourceforu.com on May 11, 2018.

Setup Multi-node Kubernetes cluster with kubeadm and vagrant

Introduction

With reference to steps listed at Using kubeadm to Create a Cluster for setting up the Kubernetes cluster with kubeadm. I have been working on an automation to setup the cluster. The result of it is kubeadm-vagrant, a github project with simple steps to setup your kubernetes cluster with more control on vagrant based virtual machines.

Installation

  • Clone the kubeadm-vagrant repo

git clone https://github.com/coolsvap/kubeadm-vagrant

  • Choose your distribution of choice from CentOS/Ubuntu and move to the specific directory.
  • Configure the cluster parameters in Vagrantfile. Refer below for details of configuration options.

vi Vagrantfile

  • Spin up the cluster

vagrant up

  • This will spin up new Kubernetes cluster. You can check the status of cluster with following command,

sudo su

kubectl get pods –all-namespaces

Cluster Configuration Options

  1. You need to generate a KUBETOKEN of your choice to be used while creating the cluster. You will need to install kubeadm package on your host to create the token with following command

# kubeadm token generate

148a37.736fd53655b767b7

  1. BOX_IMAGE is currently default with “coolsvap/centos-k8s” box which is custom box created which can be used for setting up the cluster with basic dependencies for kubernetes node.
  2. Set SETUP_MASTER to true if you want to setup the node. This is true by default for spawning a new cluster. You can skip it for adding new minions.
  3. Set SETUP_NODES to true/false depending on whether you are setting up minions in the cluster.
  4. Specify NODE_COUNT as the count of minions in the cluster
  5. Specify  the MASTER_IP as static IP which can be referenced for other cluster configurations
  6. Specify NODE_IP_NW as the network IP which can be used for assigning dynamic IPs for cluster nodes from the same network as Master
  7. Specify custom POD_NW_CIDR of your choice
  8. Setting up kubernetes dashboard is still a WIP with K8S_DASHBOARD option.

Kata Containers Dev environment setup with Vagrant

With reference to Kata Containers Developers Guide steps, I setted up the  development environment. At the same time, I went ahead and created a little automation to recreate the environment with Vagrant.

The primary code to create the environment is pushed at vagrant-kata-dev.

For setting it up, you will need,

  • VirtualBox (Currently only tested with virtualbox)
  • Vagrant with following plugins
    • vagrant-vbguest
    • vagrant-hostmanager
    • vagrant-share

To Install the plugins, use following command,

$ vagrant plugin install <plugin-name>

The setup instructions are simple, once you have installed the prereqs, clone the repo

$ git clone https://github.com/coolsvap/vagrant-kata-dev

Edit the Vagrantfile to update details

  1. Update the bridge interface so the box will have IP address from your local network using DHCP. If you do not update, it will ask for the interface name you start machine.
  2. Update the golang version, currently its at 1.9.3

Create the vagrant box with following command

$ vagrant up

Once the box is started, login to the box using following command

$ vagrant ssh

Switch to root user and move to vagrant shared directory and install the setup script

$ sudo su

# cd /vagrant

# ./setup-kata-dev.sh

It will perform the steps required to setup the dev environment. Verify the setup done correctly with following steps

# docker info | grep Runtime
WARNING: No swap limit support
Runtimes: kata-runtime runc
Default Runtime: runc

Hope this helps new developers get started with Kata Development. This is just first version of the automation and please help me better with your inputs.


Dive-In Microservices #4 – Some more patterns to look at!

Health Checks

Health checks are becoming an essential part of modern microservices setup. Every service is expected expose a health check endpoint which can be accessed by server monitoring tool. Health checks provide important attributes as they allow the process responsible for running the application to restart or kill it when it starts to misbehave or fail. Design with this pattern needs to be incredibly careful and not too aggressive to use major cycles to utilize this.

What needs to be recorded with health checks is entirely one’s choice. However, you might run into some recommendations as follows,

– Data store connection status (general connection state, connection pool status)

– Current response time (rolling average)

– Current connections

– Bad requests (running average)

How to determine what would cause an unhealthy state needs to be part of the discussion during the design of the service. For example, no connectivity to the database means the service is completely inoperable, it would report unhealthy and would allow the orchestrator to recycle the container at the same time, an exhausted connection pool could just mean that the service is under high load, and while it is not completely inoperable it could be suffering degraded performance and should just serve a warning.

The same goes for the current response time, when you load test your service once it has been deployed to production, you can build up a picture of the thresholds of operating health. These numbers can be stored in the config and used by the health check. For example, if you know that your service will run an average service request with a 50 milliseconds latency for 4,000 concurrent users; however at 5,000, this time grows to 500 milliseconds as you have exhausted the connection pool. You could set your SLA upper boundary to be 100 milliseconds; then you would start reporting degraded performance from your health check. This should, however, be a rolling average based on the normal distribution. It is always possible for one or two requests to greatly be outside the standard deviation of normal operation, and you do not want to allow this to skew your average which then causes the service to report unhealthy, when in fact the slow response was actually due to the upstream service having slow network connectivity, not your internal state.

When discussing health checks, the pattern of a handshake is considered in most occasions, where each client would send a handshake request to the downstream service before connecting to check if it was capable of receiving its request. Under normal operating conditions and most of the time, this adds an enormous amount of chatter into your application resulting in an overkill. It also implies that you are using client-side load-balancing, as with a server side approach you would have no guarantees that the service you handshake is the one you connect to. The concept however of the downstream service making a decision that it can or can’t handle a request is a valid one. Why not instead call your internal health check as the first operation before processing a request? This way you could immediately fail and give the client the opportunity to attempt another endpoint in the cluster. This call would add almost no overhead to your processing time as all you are doing is reading the state from the health endpoint, not processing any data.

Load balancing

When we discussed service discovery, we examined the concepts of server-side and client-side discovery. For many years server-side discovery was the only option, and there was also a preference for doing SSL termination on the load balancer due to the performance problems. It is a good idea to use TLS secure connections internally. However, what about being able to do sophisticated traffic distribution? That can only be achieved if you have a central source of knowledge. However, there could be a benefit to only sending a certain number of connections to a particular host; but then how do you measure health? You can use layer 6 or 7, but as we have seen by using smart health checks, if the service is too busy then it can just reject a connection. To be able to implement multiple strategies for the load balancer, such as round-robin, random, or more sophisticated strategies like distributed statistics, across multiple instances you can define your own strategy.

Caching

One way you can improve the performance of service is by caching results from databases and other downstream calls in an in-memory cache or a side cache like Redis, rather than by hitting a database every time. Caches are designed to deliver massive throughput by storing precompiled objects in a fast-access data store, frequently based around a concept of a hash key. We know from looking at algorithm performance that a hash table has the average performance of O(1); that is as fast as it gets. Without going too in depth into Big O notation, this means it takes one iteration to be able to find the item you want in the collection. What this means is that, not only can one reduce the load on database, can also reduce your infrastructure costs. Typically, a database is limited by the amount of data that can be read and written from the disk and the time it takes for the CPU to process this information. With an in-memory cache, this limitation is removed by using pre-aggregated data, which is stored in fast memory, not onto a state-full device like a disk. This comes at the cost of consistency because one cannot guarantee that all clients will have the same information at the same time.

Caching strategies can be calculated based on your requirements for this consistency. In theory, the longer the cache expiry, the greater cost saving, and the faster system is, at the expense of reduced consistency. So when planning a feature, one should be talking about consistency and the tradeoffs with performance and cost, and documenting this decision, as these decisions will greatly help create a more successful implementation.

You have probably heard the phrase Premature optimization, so does that mean you should not implement caching until you need it? No; it means you should be attempting to predict the initial load that your system will be under at design time, and the growth in capacity over time, as you are considering the application lifecycle. When creating this design, you will be putting together this data, and you will not be able to reliably predict the speed at which a service will run at. However, you do know that a cache will be cheaper to operate than a data store; so, if possible, you should be designing to use the smallest and cheapest data store possible, and making provision to be able to extend your service by introducing caching at a later date. This way you only do the actual work necessary to get the service out of the door, but you have done the design up front to be able to extend the service when it needs to scale.

The cache will normally have an end date on it. However, if you implement the cache in a way that the code decides to invalidate it, then you can potentially avoid problems if a downstream service or database disappears. Again, this is back to thinking about failure states and asking what is better: the user seeing slightly out-of-date information or an error page? If your cache has expired, the call to the downstream service fails. However, you can always decide to serve the stale cache back to the calling client. In some instances, this will be better than returning a 50x error.

Dive-In Microservices #3 – Patterns – Circuit Breaking

Before we delve deeper into circuit breaking pattern let us understand couple of patterns which will help us understand it better.

Pattern – Timeouts

A timeout is an incredibly useful pattern while communicating with other services or data stores. The idea is that you set a limit on the response of a server and, if you do not receive a response in the given time, then you write a business logic to deal with this failure, such as retrying or sending a failure message back to the upstream service. A timeout could be the only way of detecting a fault with a downstream service. However, no reply does not mean the server has not received and processed the message, or that it might not exist. The key feature of a timeout is to fail fast and to notify the caller of this failure.

There are many reasons why this is a good practice, not only from the perspective of returning early to the client and not keeping them waiting indefinitely but also from the point of view of load and capacity. Timeouts are an effective hygiene factor in large distributed systems, where many small instances of a service are often clustered to achieve high throughput and redundancy. If one of these instances is malfunctioning and you, unfortunately, connect to it, then this can block an entirely functional service. The correct approach is to wait for a response for a set time and then if there is no response in this period, we should cancel the call, and try the next service in the list. The question of what duration your timeouts are set to do not have a simple answer. We also need to consider the different types of timeout which can occur in a network request, for example, you have:

Connection Timeout – The time it takes to open a network connection to the server

Request Timeout – The time it takes for a server to process a request

The request timeout is almost always going to be the longest duration of the two and I recommend the timeout is defined in the configuration of the service. While you might initially set it to an arbitrary value of, say 10 seconds, you can modify this after the system has been running in production, and you have a decent data set of transaction times to look at.

Pattern – Back off

Typically, once a connection has failed, you do not want to retry immediately to avoid flooding the network or the server with requests. To allow this, it’s necessary to implement a back-off approach to your retry strategy. A back-off algorithm waits for a set period before retrying after the first failure, this then increments with subsequent failures up to a maximum duration.

Using this strategy inside a client-called API might not be desirable as it contravenes the requirement to fail fast. However, if we have a worker process that is only processing a queue of messages, then this could be exactly the right strategy to add a little protection to your system.

Pattern – Circuit breaking

We have looked at some patterns like timeouts and back-offs, which help protect our systems from cascading failure in the instance of an outage. However, now it’s time to introduce another pattern which is complementary to this duo. Circuit breaking is all about failing fast, it is a way to automatically degrade functionality when the system is under stress.

Let us consider an example of a frontend example web application that is dependent on a downstream service to provide recommendations for services user can use. Because this call is synchronous with the main page load, the web server will not return the data until it has successfully returned recommendations. Now you have designed for failure and have introduced a timeout of five seconds for this call. However, since there is an issue with the recommendations system, a call which would ordinarily take 20 milliseconds is now taking 5,000 milliseconds to fail. Every user who looks at a services is waiting five seconds longer than usual; your application is not processing requests and releasing resources as quickly as normal, and its capacity is significantly reduced. In addition to this, the number of concurrent connections to the main website has increased due to the length of time it is taking to process a single page request; this is adding load to the front end which is starting to slow down. The net effect is going to be that, if the recommendations service does not start responding, then the whole site is headed for an outage.

There is a simple solution to this: you should stop attempting to call the recommendations service, return the website back to normal operating speeds, and slightly degrade the functionality of the services page. This has three effects:

– You restore the browsing experience to other users on the site.

– You slightly degrade the experience in one area.

– You need to have a conversation with your stakeholders before you implement this feature as it has a direct impact on the system’s business.

Now in this instance, it should be a relatively simple sell. Let’s assume that recommendations increase conversion by 1%; however, slow page loads reduce it by 90%. Then isn’t it better to degrade by 1% instead of 90%? This example, is clear cut but what if the downstream service was a stock checking system; should you accept an order if there is a chance you do not have the stock to fulfill it?

So how will it work ?

Under normal operations, like a circuit breaker in your electricity switch box, the breaker is closed and traffic flows normally. However, once the pre-determined error threshold has been exceeded, the breaker enters the open state, and all requests immediately fail without even being attempted. After a period, a further request would be allowed and the circuit enters a half-open state, in this state a failure immediately returns to the open state regardless of the error threshold. Once some requests have been processed without any error, then the circuit again returns to the closed state, and only if the number of failures exceeded the error threshold would the circuit open again.

Error behaviour is not a question that software engineering can answer on its own; business stakeholders need to be involved in this decision. When you are planning the design of your systems, you talk about failure as part of your non-functional requirements and decide ahead of time what you will do when the downstream service fails.

Dive-In Microservices #2 – Patterns – Service discovery

With monolithic applications, services invoke one another through language level methods or procedure calls. This was relatively straightforward and predictable behavior. As application complexity increased we realized that monolithic applications were not suitable for the scale and demand of modern software, so we moved towards SOA or service-oriented architecture. The monoliths were broken into smaller chunks that typically served a particular purpose. But SOA brought its own caveats in the picture with inter-service calls, SOA services ran at well-known fixed locations, which resulted in static location of services, IP addresses, reconfiguration issues with deployments to name a few.

Microservices are easy; building microservice systems is hard

With microservices all this changes, the application typically runs in a virtualized or containerized environment where the number of instances of a service and their locations can change dynamically, minute by minute. This gives us the ability to scale our application depending on the forces dynamically applied to it, but this flexibility does not come without its own share of problems. One of the main ones knows where your services are to contact them. Without the right patterns, it can almost be impossible, and one of the first ones you will most likely stumble upon even before you get your service out into production is service discovery.

With Service discovery, the services register with the dynamic service registry upon startup, and in addition to the IP address and port they are running on, will also often provide metadata, like service version or other environmental parameters that can be used by a client when querying the registry. Some of the popular examples of service registry are Consul, Etcd. These systems are highly scalable and have strongly consistent methods for storing the location of your services. In addition to this, the consul has the capability to perform health checks on the service to ensure its availability. If the service fails a health check then it is marked as unavailable in the registry and will not be returned by any queries.

There are two main patterns for service discovery,

Server-side service discovery

Server-side service discovery is a microservice antipattern for inter-service calls within the same application. This is the method we used to call services in an SOA environment. Typically, there will be a reverse proxy which acts as a gateway to your services. It contacts the dynamic service registry and forwards your request on to the backend services. The client would access the backend services, implementing a known URI using either a subdomain or a path as a differentiator.

Server side discovery eventually runs into some well known issues, one of them being reverse proxy bottleneck. The backend services can be scaled quickly enough but it requires monitoring. It also introduces latency causing increase in cost for running and maintaining the application.

Server side discovery also potentially increases the failure patterns with downstream calls, internal services and external services. With server side discovery you also need to have a centralize failure logic on server side, which abstracts most of API knowledge from client, handles failures internally, keeps retrying internally and keeping client completely distant till its a success or catastrophic failure.

Client-side service discovery

While server-side service discovery might be an acceptable choice for your public APIs for any internal inter-service communication, I prefer the client-side pattern. This gives you greater control over what happens when a failure occurs. You can implement the business logic on a retry of a failure on a case-by-case basis, and this will also protect you against cascading failure.

This pattern is similar to its server-side partner. However, the client is responsible for the service discovery and load balancing. You still hook into a dynamic service registry to get the information for the services you are going to call. This logic is localized in each client, so it is possible to handle the failure logic on a case-by-case basis.

Dive-In Microservices #1 – Patterns – Event Processing

Event processing is a model which allows you to decouple your micro services by using a message queue. Rather than connect directly to a service which may or may not be at a known location, you broadcast and listen to events which exist on a queue, such as Redis, Amazon SQS, RabbitMQ, Apache Kafka, and a whole host of other sources.

The message queue is a highly distributed and scalable system, and it should be capable of processing millions of messages so we do not need to worry about it not being available. At the other end of the queue, there will be a worker who is listening for new messages pertaining to it. When it receives such a message, it processes the message and then removes it from the queue.

Due to the async nature of the event processing pattern there needs to be a requirement to handle failures in a programmable way,

Event processing with at least once delivery

One of first and basic sync mechanism is to request for delivery, we add the message to the queue and then wait for an ACK from the queue to let us know that the message has been received. Of course, we would not know if the message has been delivered but receiving the ACK should be enough for us to notify the user and proceed. There is always the possibility that the receiving service cannot process the message which could be due to a direct failure or bug in the receiving service or it could be that the message which was added to the queue is not in a format which can be read by the receiving service. We need to deal with both of these issues independently, with handling errors discussed next.

Handling Errors

It is not uncommon for things to go wrong with distributed systems and is the essential factor in micro-service based software design. As per above scenario, if a valid message can not be processed one standard approach is to retry processing the message, normally with a delay. It is important to append the error every time we fail to process a message as it gives us the history of what went wrong, it also provides us with the capability to understand how many times we have tried to process the message because after we exceed this threshold we do not want to continue to retry we need to move this message to a second queue or a dead letter que which we will discuss next.

Debugging the failures with Dead Letter Queue

It is most common practice to remove the message from queue once it is processed. The purpose of the dead letter queue is so that we can examine the failed messages on this queue to assist us with debugging the system. Since we can append the error details to the message body, we know what the error is and we know where the history lies if we need it.

Working with idempotent transactions

While many message queues nowadays offer At Most Once Delivery in addition to the At Least Once, the latter option is still the best for large throughput of messages. To deal with the fact that the receiving service may receive a message twice it needs to be able to handle this in its own logic. One of the common methods for ensuring that the message is not processed twice is to log the message ID in a transactions table. If the message has already been processed and if it will be disposed.

Working with the ordering of messages

One of the common issue while handling failures with retry is receiving a message out of sequence or in an incorrect order, which will end up with inconsistent data in the database. One potential way to avoid this issue is to again leverage the transaction table and to store the message dispatch_date in addition to the id. When the receiving service receives a message then it can not only check if the current message has been processed it can check that it is the most recent message and if not discard it.

Working with atomic transactions

This is the common issue found when moving the legacy systems to micro-services. While storing data, a database can be atomic: that is, all operations occur or none do. Distributed transactions do not give us the same kind of transaction that is found in a database. When part of a database transaction fails, we can roll back the other parts of the transaction. By using this pattern we would only remove the message from the queue if the process succeeded so when something fails, we keep retrying. This gives us a kind of eventually consistent transaction.

Unfortunately, there is no one solution fits all with messaging we need to tailor the solution which matches the operating conditions of the service.